

Ready to become a Power BI Master? Vaanga Kathukalam!
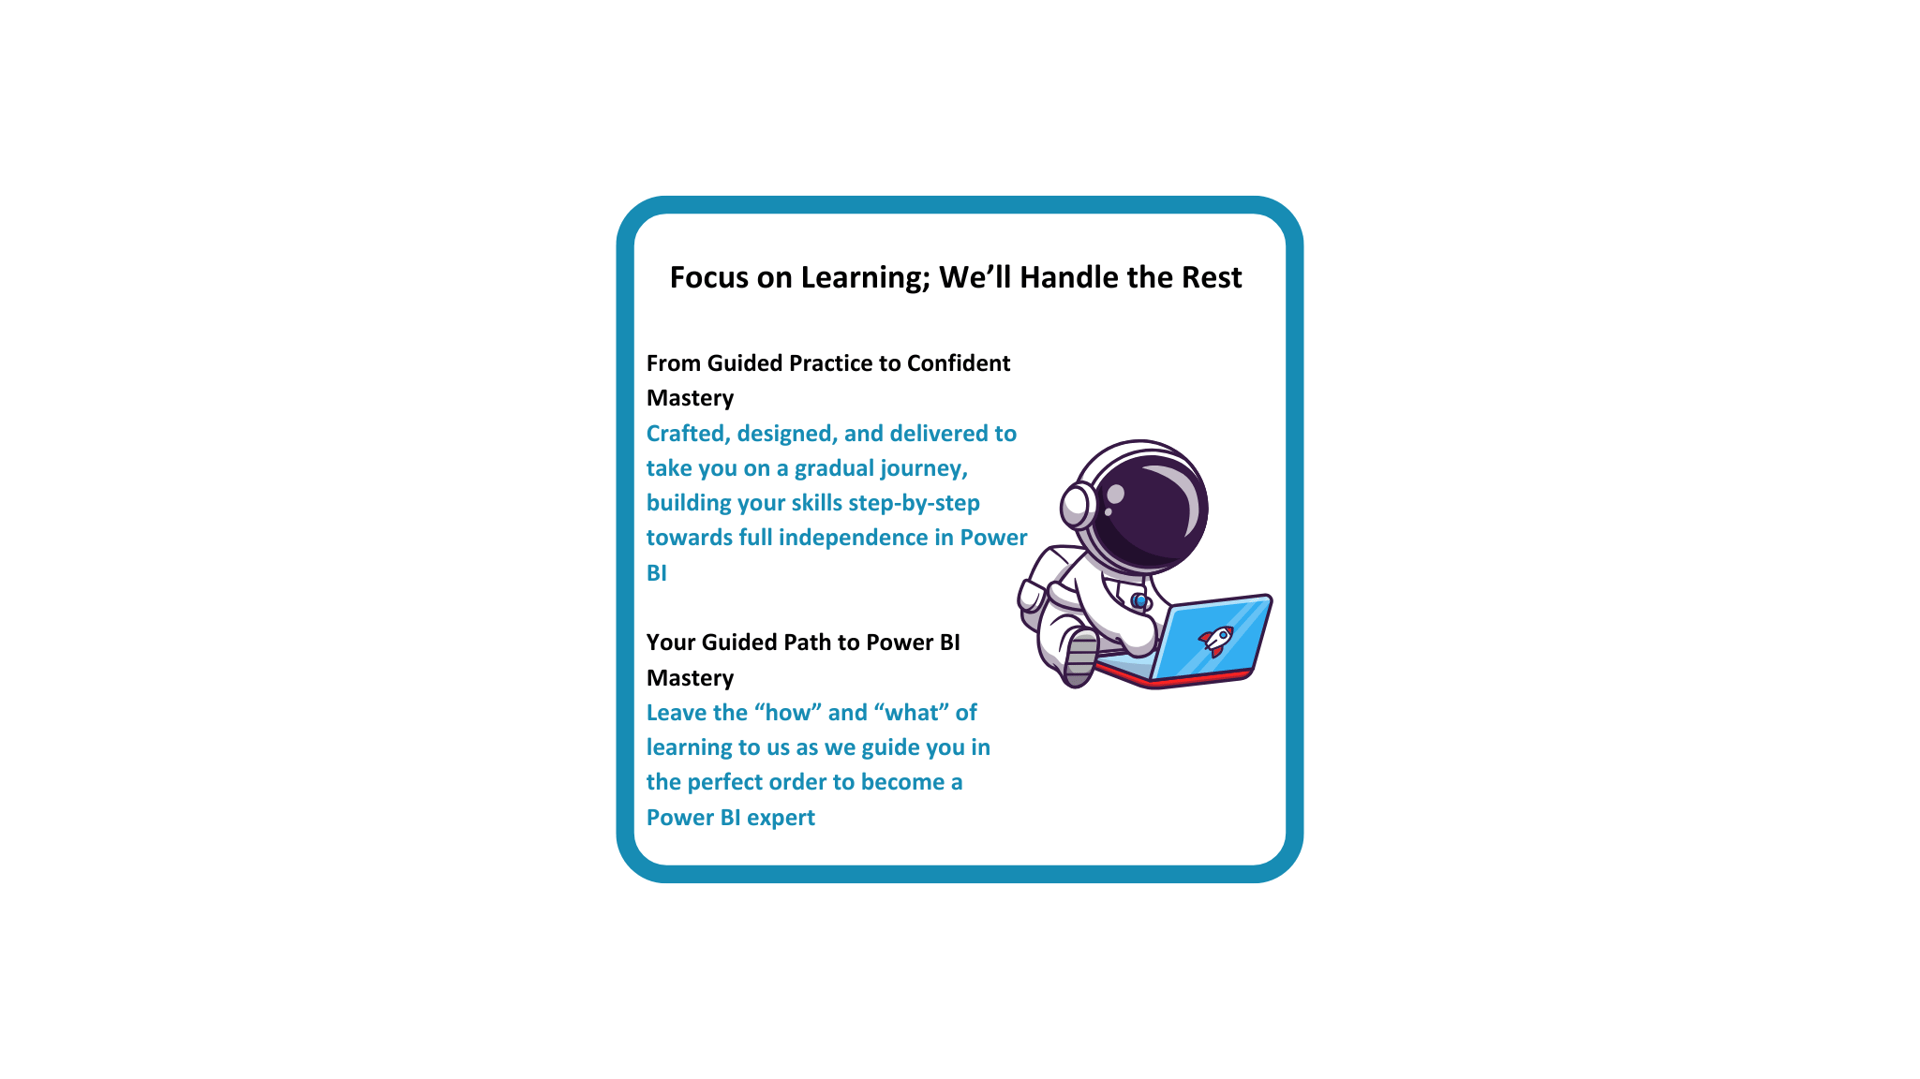
Our course guides you step-by-step, teaching both Power BI Skills and Data Visualization Principles to help your dashboards stand out. Enroll today to start your journey to Power BI expertise!


You will get access to our learning portal through which the courses are delivered


HURRY!!! LIMITED SEATS ONLY
Original Price - Rs. 9999
Offer
Price
What you will get from this course?..
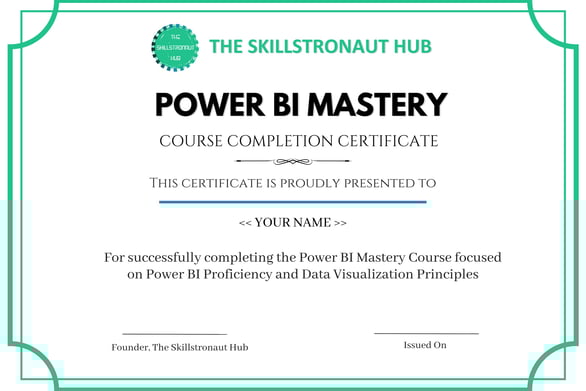
You also get a certificate for your effort

Ungaluku keezha iruka questions ellame iruka?


Keezha irukra video la ungalukana badhil iruku

Ready to level up?
Watch this video to learn more...


Video ah paathutu, enroll panna scroll pannunga


What do people feel about us?


Invest your learning time here.
Your future self will thank you!!


Power BI works only on Windows and not on Mac.
Mac users we'd love to have you, but Microsoft is keeping us apart :(


For detailed curriculum scroll down
You will get access to our learning portal through which the courses are delivered
Original Price - Rs. 9999
HURRY!!! LIMITED SEATS ONLY
Offer
Price
100,000+ companies currently use Power BI
*Gartner research report
*Based on market research based on a sample set
Power BI is the market leader in Data Visualization consecutively for 17 years
Approximately 50-60% of analyst jobs require Power BI as a skill
*Data from Microsoft Website
Why Power BI?
Are you going to lag behind??
HURRY!!! LIMITED SEATS ONLY
Original Price - Rs. 9999
Offer
Price
Who is this course for?
Anyone who is looking to change their career to a data field
Freshers looking for an entry into data analytics
Data analysts looking to upskill to stay competitive in the market
You are going to learn......
Data Basics
The Power of Visualization
Why Power BI?
Installation & Setup guide for Power BI
What is Power BI and its components?
Industry trends and scope
Loading Data
Applied Steps
Changing Data Types
Column Functions - Split and Merge
Create Columns - Custom columns and conditional columns
Append and Merge Queries
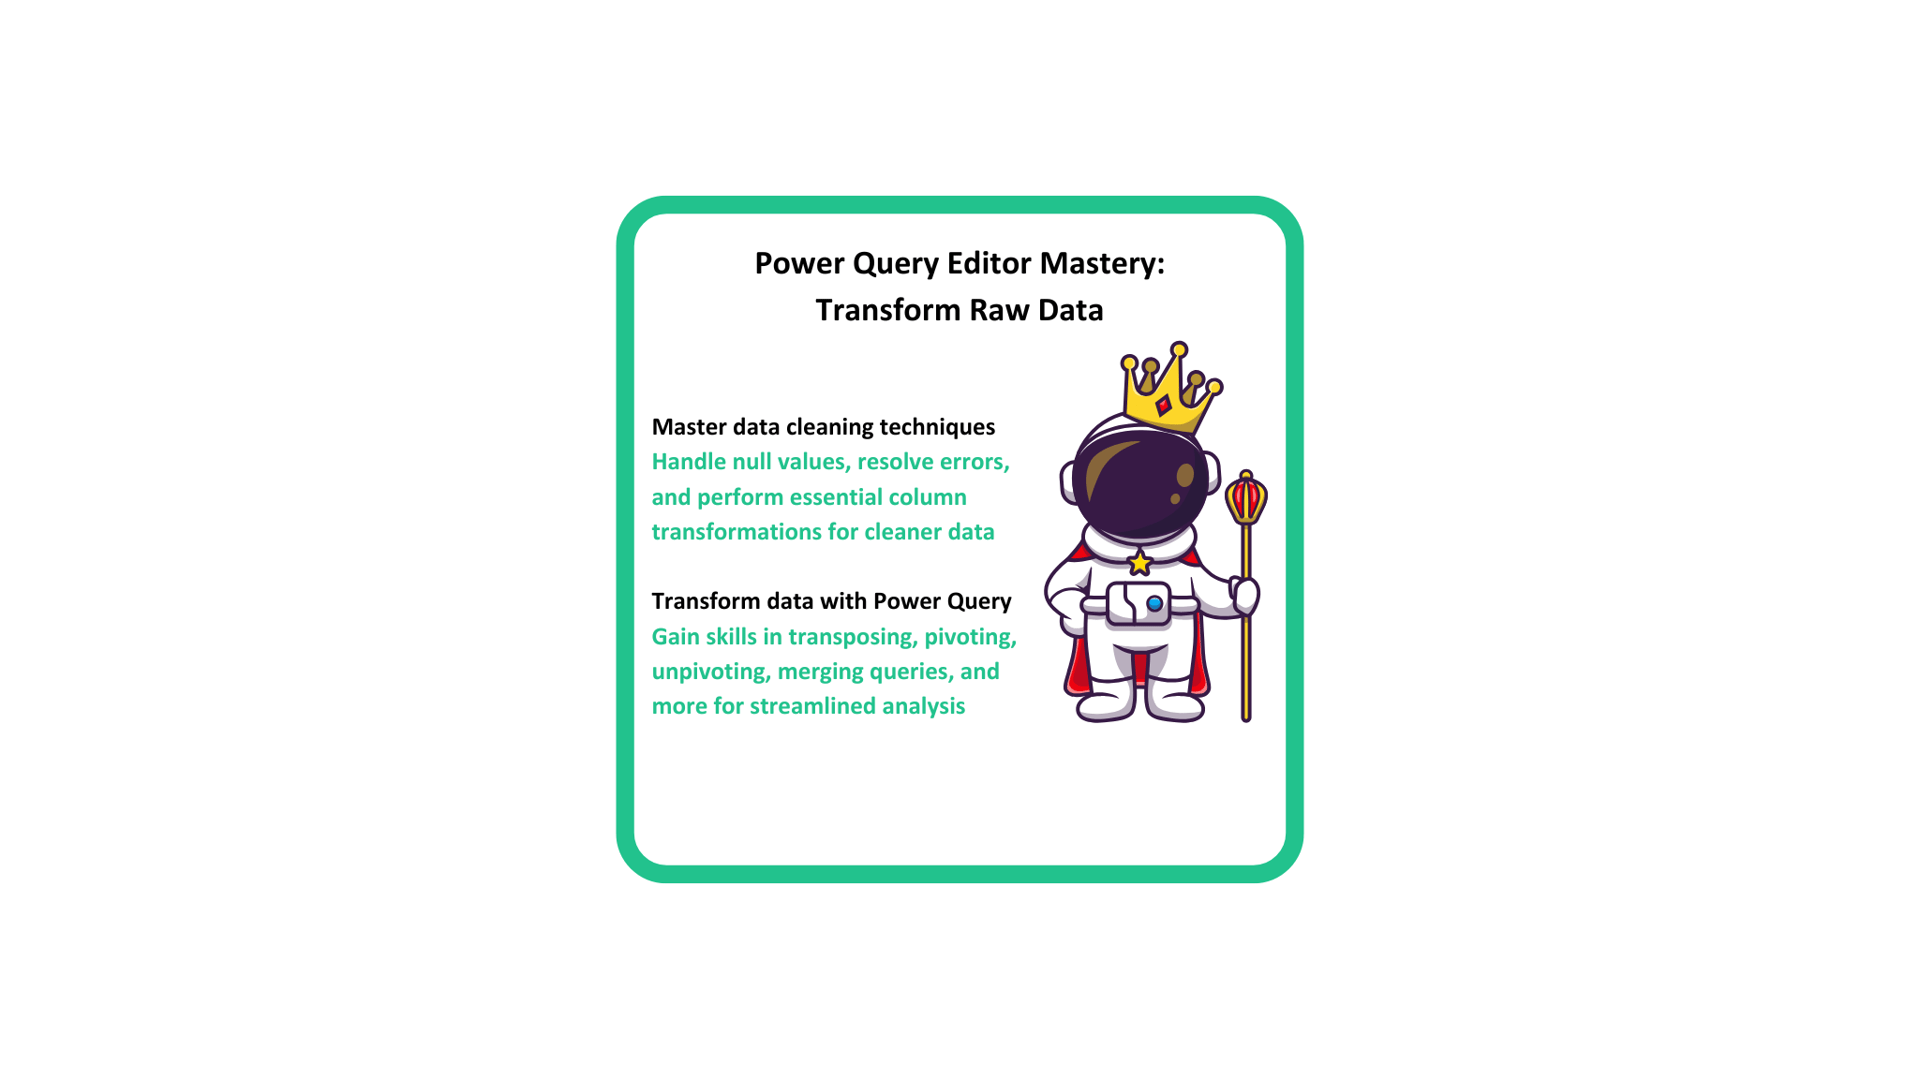
Transformation functions - Transpose, Pivot and Unpivot, Group By functions
Joins - Left, Right, Outer, Inner, Left-anti and Right-anti joins
Date and Time functions
Sort and Filters
Connect to GSheets
Create tables by entering Data
Column quality and profiling
Remove errors and nulls
M Code basics
Parameters and Custom functions
Introducing you to Data
Become a Power Query Wizard
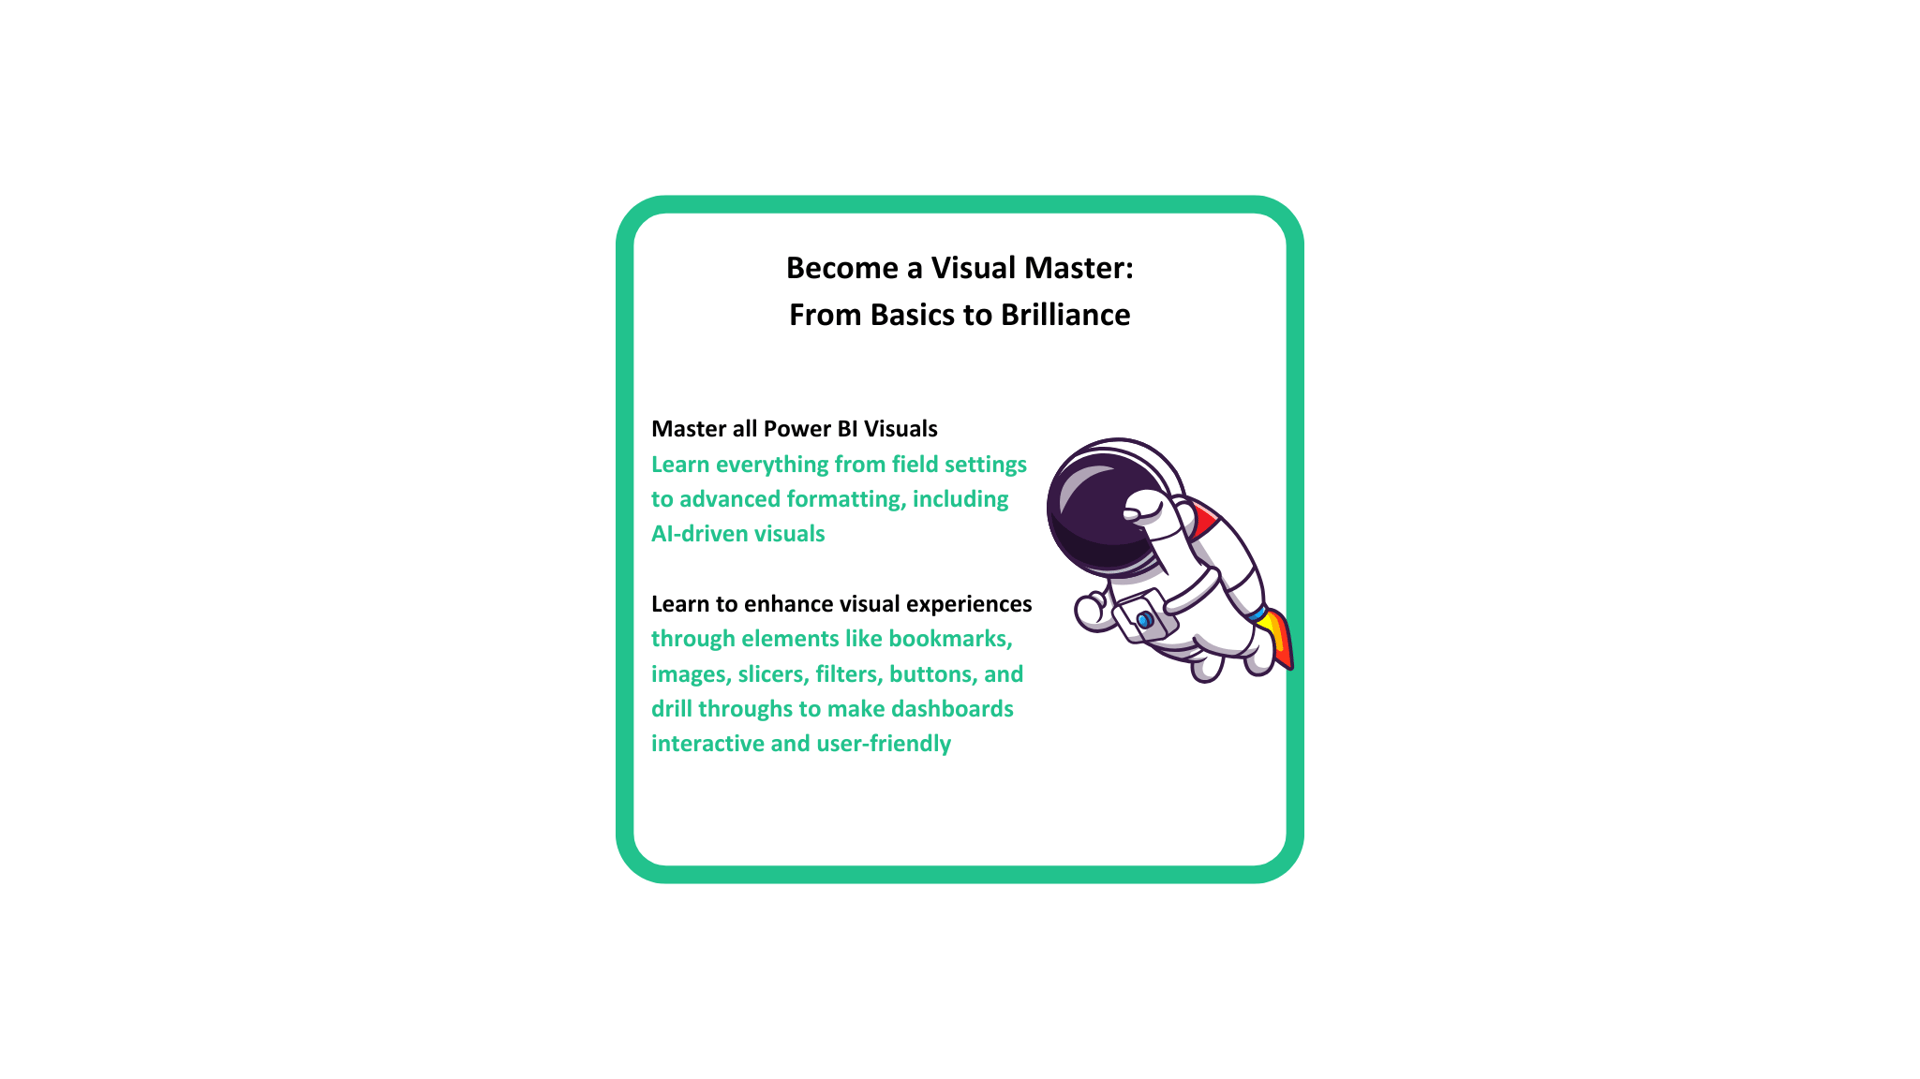
Understanding Visuals
Basic Visuals - Bar charts, Line Chart, Pie/Donut Charts, Cards, Area charts, Tables and Matrix
Advanced Visuals - Scatter Plots, Waterfall Charts, Funnel Charts, Treemaps, Geo Maps, Ribbon charts, Gauge and KPIs
AI Visuals - Q&A, Decomposition Tree, Narratives and Key Influencers
Characteristics and properties of all the visuals
Formatting options for visuals
Canvas formatting
Tooltips
Filters and Slicers
Hierarchy and Drill-downs
Drill-through
Bookmarks
Selection Pane
Insert elements - Shapes, Images, Buttons and Text Box
Page and Bookmark Navigator
Row level security
Mobile layout
Themes
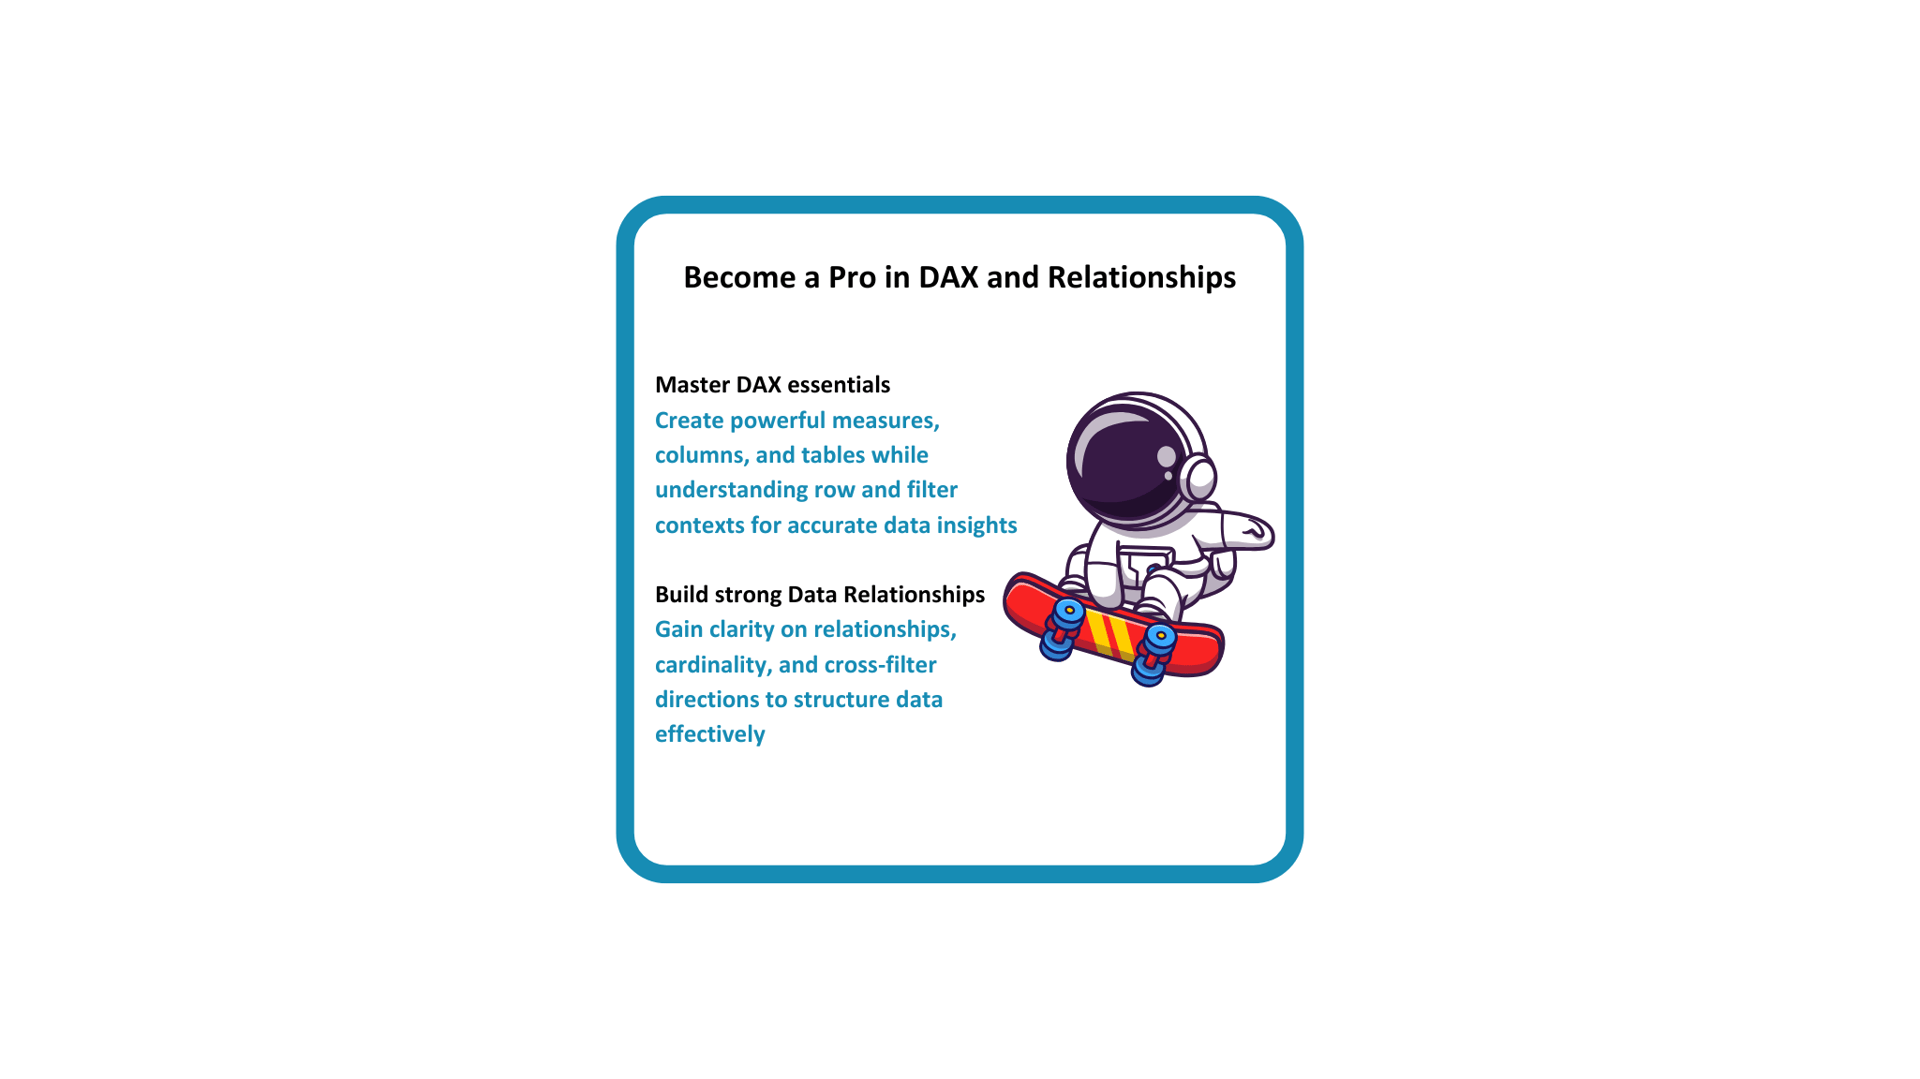
Learn to write DAX formulas
Table View
Measures vs Columns
Summarisation functions - SUM, SUMX, COUNT, COUNTX, COUNTA, COUNTAX, DISTINCTCOUNT
Row context vs Filter Context
Filter Modifiers - CALCULATE, REMOVEFILTERS
Create Tables - ALL, FILTER, VALUES
Conditional functions - IF, SWITCH
Date functions - DATEDIFF, EOMONTH, EDATE, WEEKDAY, NETWORKDAYS
String Functions - CONCATENATE, CONCATENATEX, String Operator '&'
Math Functions
Home Table
Power BI Service
Mastering Relationships
Cardinality - One to One, One to Many, Many to One, Many to Many
Schemas
Establishing Relationships
Model View
Cross-filters
Filter Propogation
Introduction to Power BI Service
Layout and Workspaces
Reports
Dashboards
Semantic Models
Row Level Security
Report Sharing
Custom Visuals
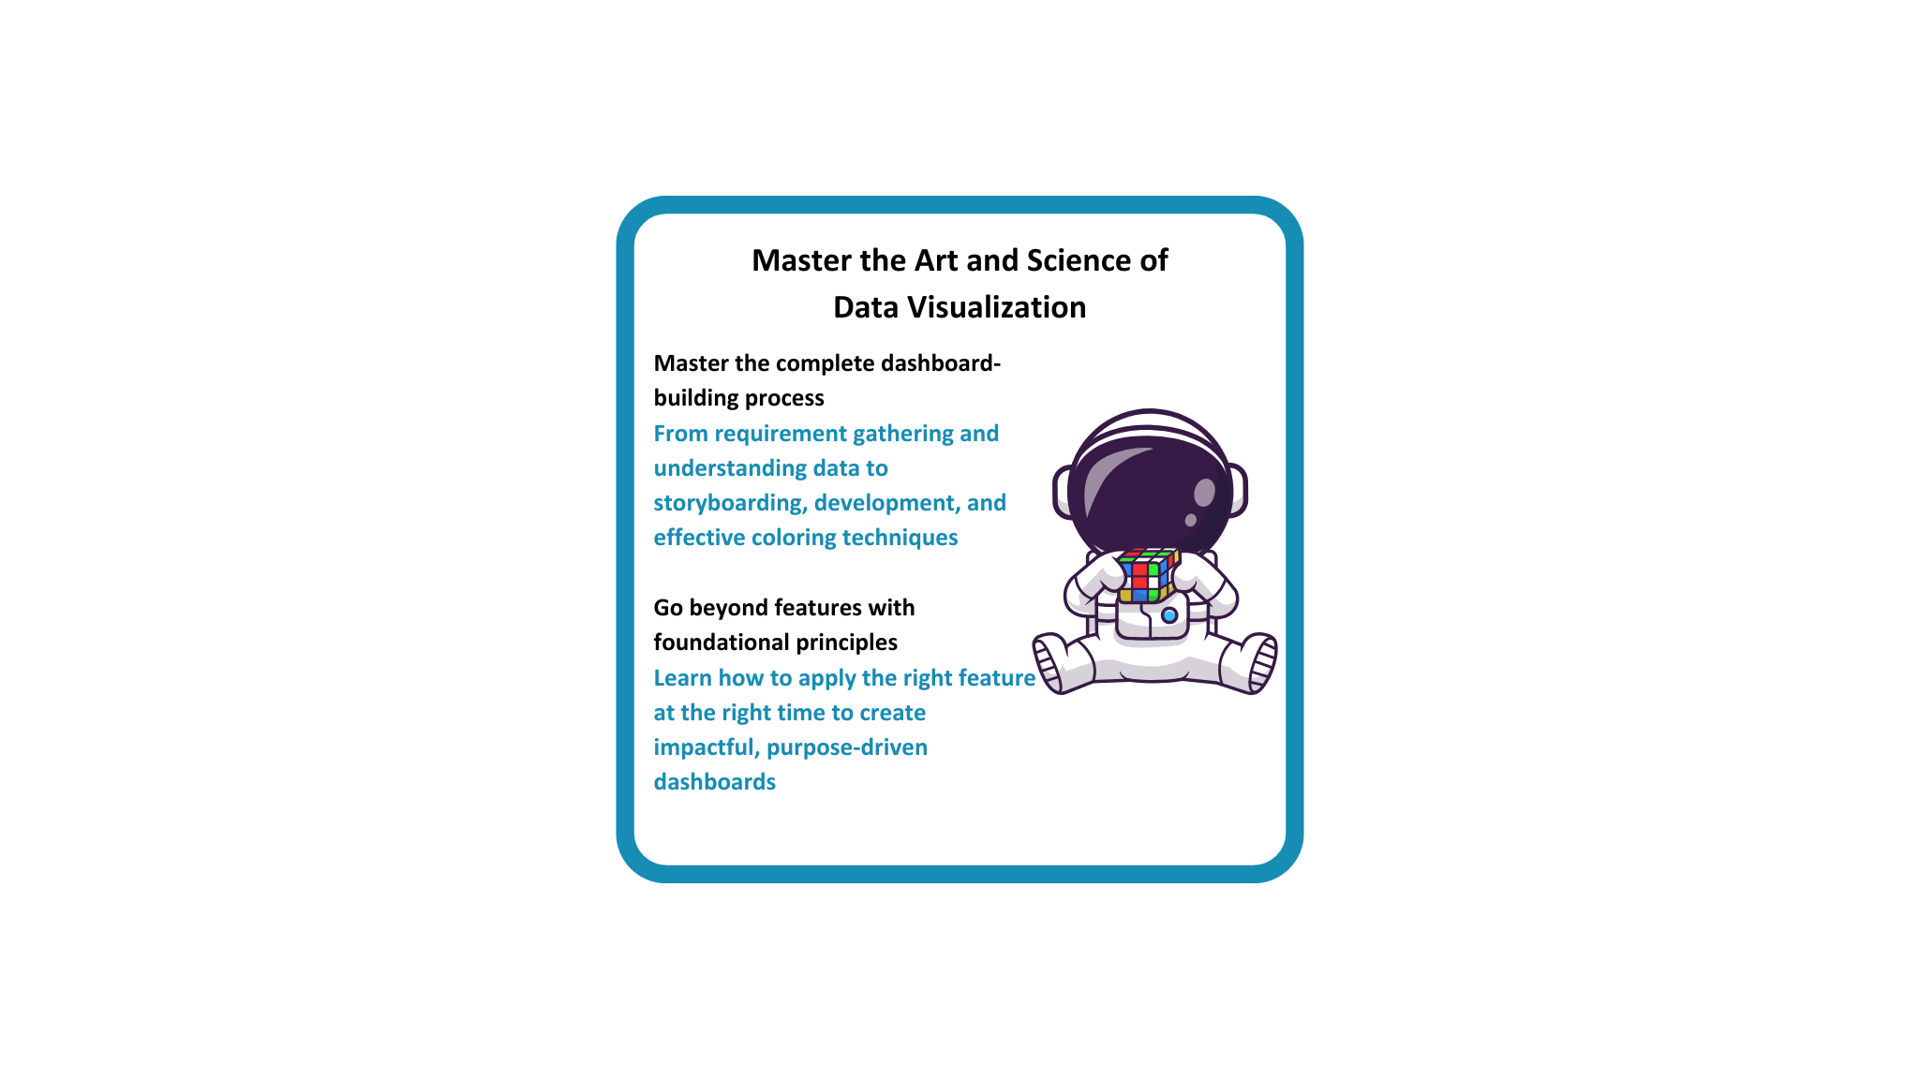
Data Visualization Framework
How to choose right charts?
Requirement Gathering
Characteristics of Data
Data Preperation Steps
How to plan the report layout?
Colors and Designs
Project & Hackathon
Guided Project - You will work on a full-fledged industry standard data visualization project, where you will implement all the technical learnings and the data visualization framework
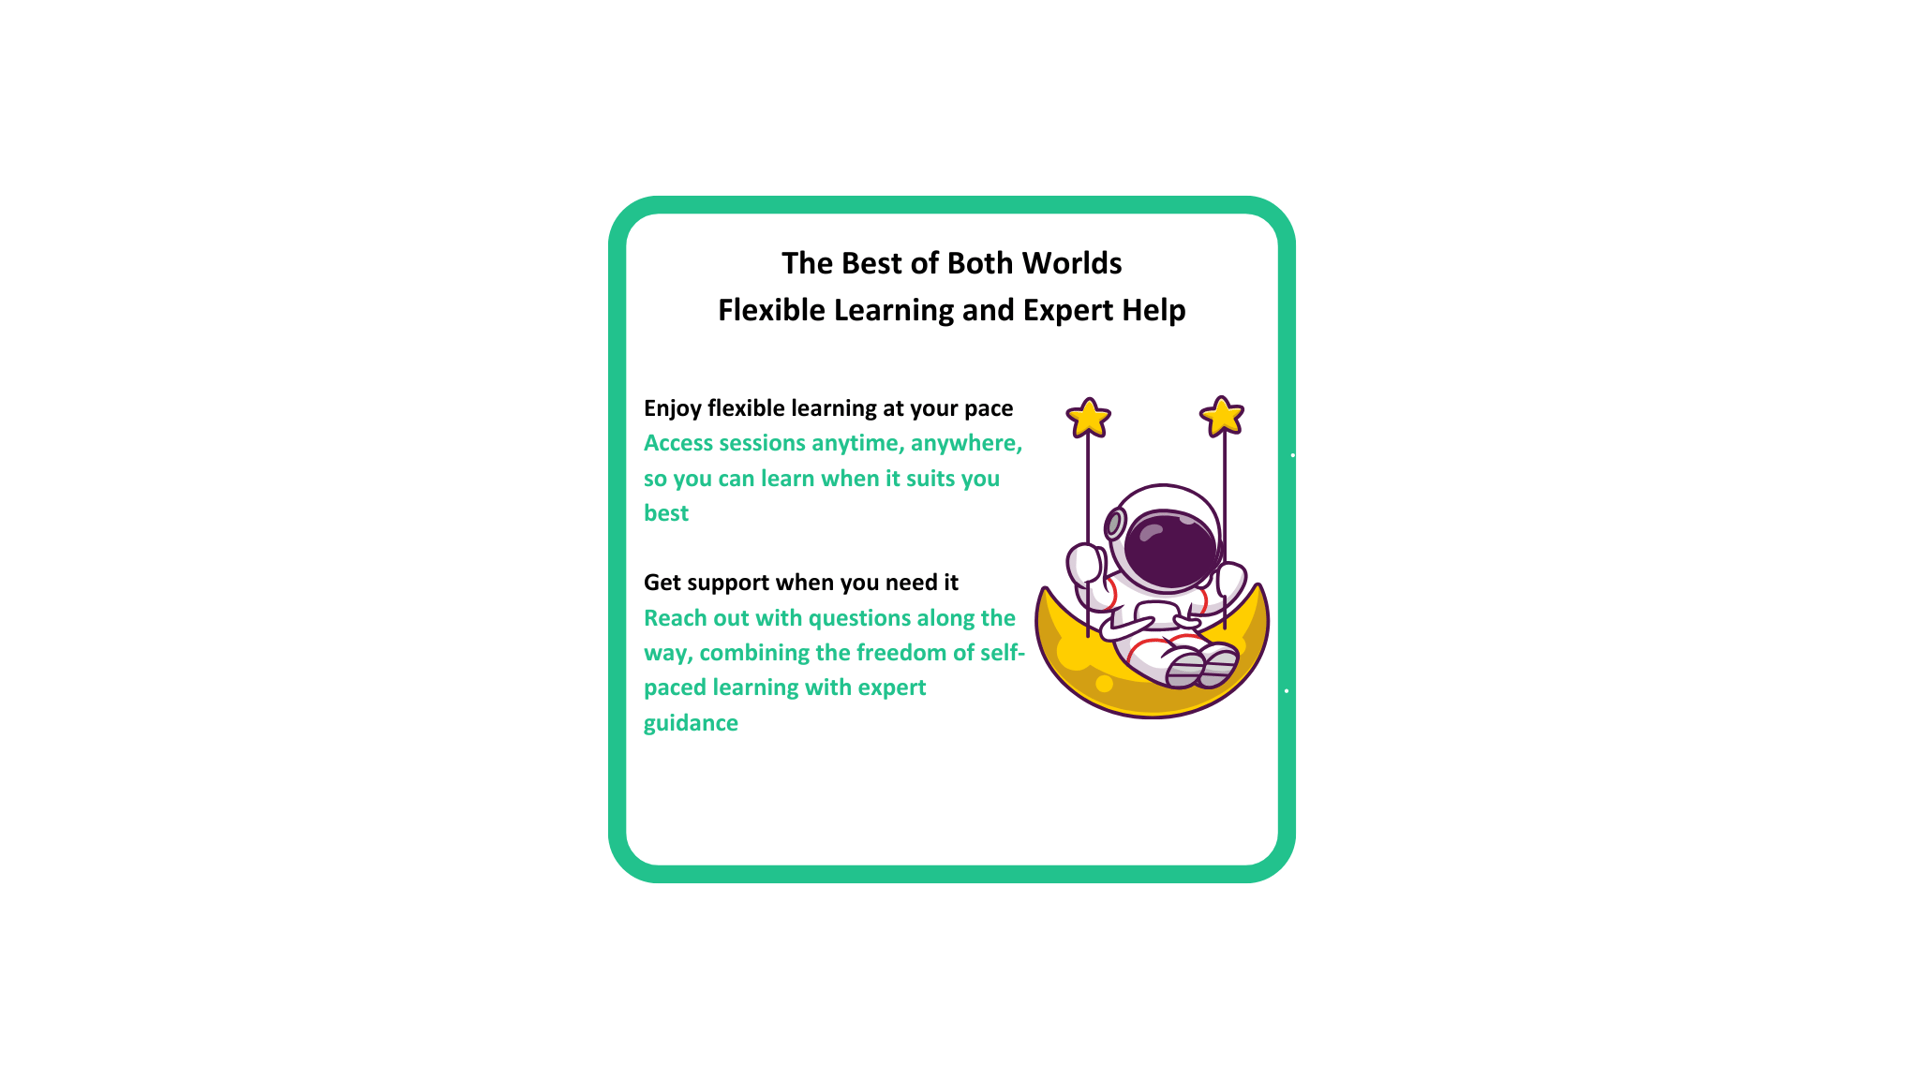
Hackathon - Step by step instructions for a self-paced DO IT YOURSELF hackathon
Follow us
See it, Hear it, Love it.......
Our Instagram Feed


Meet the Course Curators


Arun is a seasoned product manager with a wealth of experience in data analytics and visualizations. A specialist in product design and client relations, he excels at utilizing data to solve niche business challenges and deliver tailored solutions.
His deep expertise in translating data into actionable insights, and a personal passion for empowering others through education has led to the creation of The Skillstronaut Hub. With his vast experience in data-driven strategies, he ensures learners gain not just theoretical knowledge but the ability to make informed decisions and deliver results in real-world scenarios.
Priyanka is a seasoned business consultant specializing in data science and AI, with extensive experience in delivering data-driven solutions. With expertise in data analytics and visualization, where she has successfully managed diverse client portfolios and executed end-to-end projects that translate complex data into actionable business insights.
With a strong focus on leveraging cutting-edge technologies, she plays a critical role at The Skillstronaut Hub in designing courses that mirror real-world challenges, empowering learners to build relevant, industry-ready skills.
Arunachalam Rajagopal, Founder The Skillstronaut Hub
அருணாசலம் இராசகோபால்
Shanmuga Priyanka Elangovan, Co-Founder The Skillstronaut Hub
சண்முக பிரியங்கா இளங்கோவன்
About
The Skillstronaut Hub
At The Skillstronaut Hub, we are committed to empowering you with the tech skills needed to thrive in today’s data-driven world. Specializing in data analytics and visualization, we aim to deliver courses that bridge the gap between industry demands and learner capabilities, ensuring you’re market-ready.
Our courses are delivered entirely in Tamil for effortless understanding. Every aspect of our course is curated to meet the needs of both beginners and experienced professionals, ensuring the smoothest and most effective learning experience. Our expert-curated content and real-world projects give you the hands-on experience you need to excel
Join our thriving community of learners, elevate your career, and explore a universe of opportunities with The Skillstronaut Hub—your future in tech starts here.


Invest your learning time here.
Your future self will thank you!!
Power BI works only on Windows and not on Mac.
Mac users we'd love to have you, but Microsoft is keeping us apart :(